

Error Tracking
Capture browser errors, group them into issues, and manage their lifecycle.
Error Tracking
When error tracking is enabled for a verified project, Ucoder Insight automatically captures browser errors and unhandled promise rejections — no manual instrumentation is required. Captured errors are grouped into issues and reported to the dashboard for investigation.
Automatic capture
Once the SDK is initialized, errors are captured automatically as they happen in the browser, including:
- Uncaught JavaScript exceptions
- Unhandled promise rejections
- Errors with full stack traces, when available
No additional setup is needed beyond initializing the SDK — see Configuration.
Error grouping
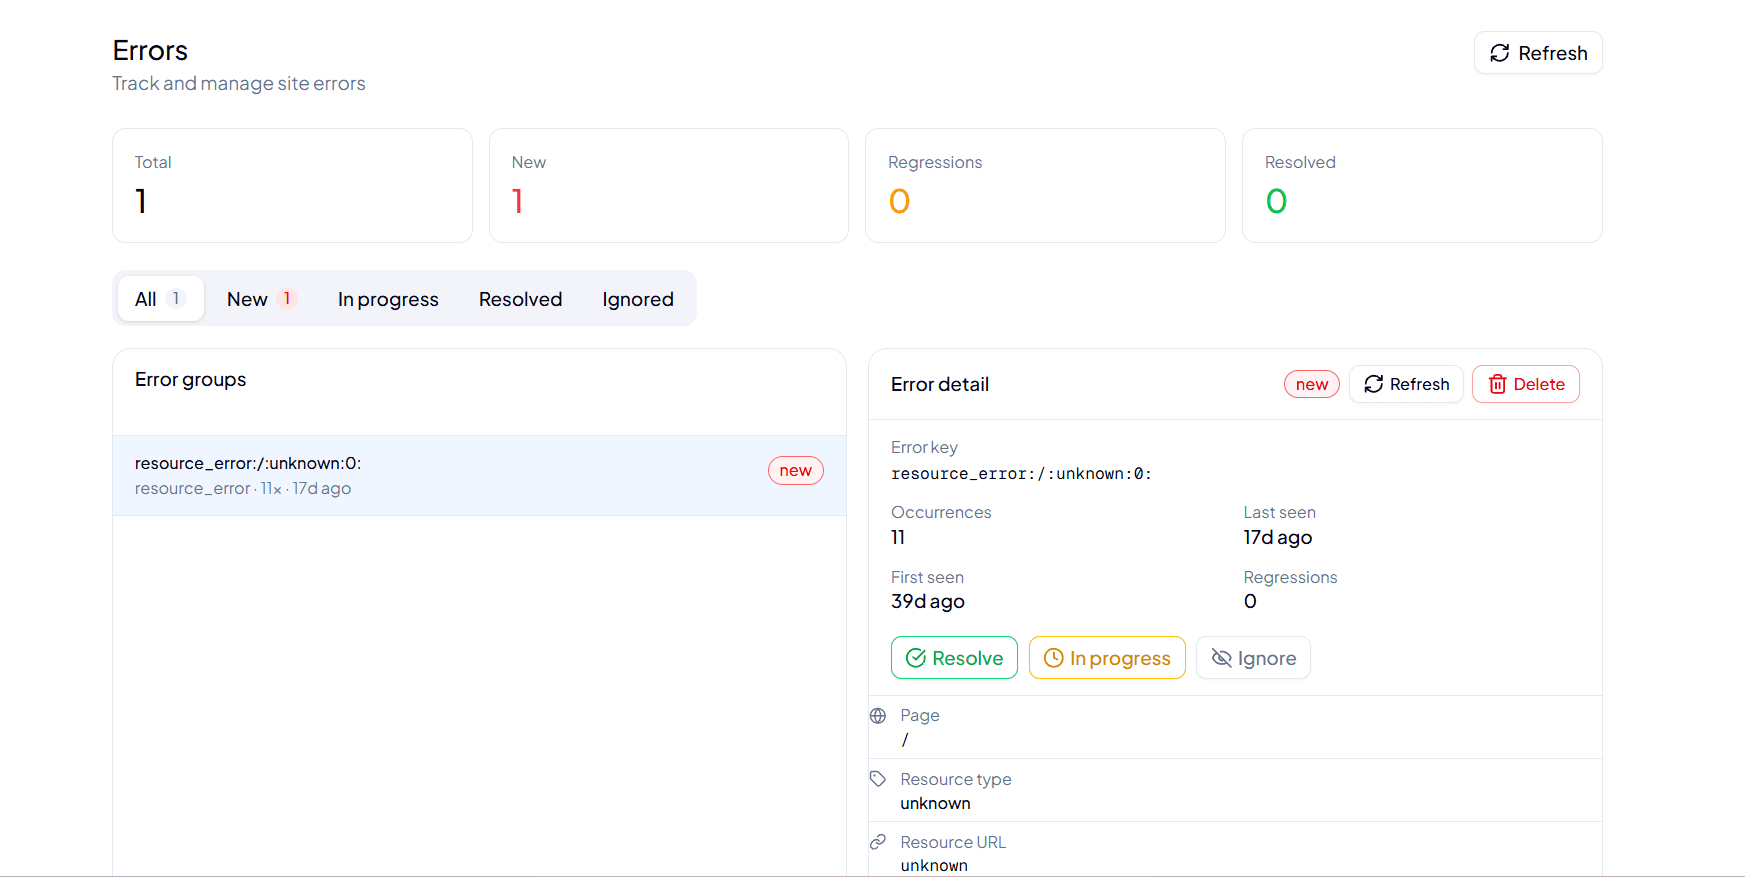
Similar errors are automatically grouped into a single issue instead of creating duplicate entries for every occurrence. Errors are grouped based on factors like error message, error type, and stack trace signature.
Each issue shows:
- Total occurrence count
- First seen and last seen timestamps
- Affected pages, browsers, and devices
- The full stack trace from a representative occurrence
Grouping reduces noise so you investigate one issue instead of hundreds of individual error events, but it also means a single issue can represent many different users and sessions — check the breakdowns before assuming the cause is the same for everyone.
Issue workflow
Each issue has a status that you can manage from the dashboard:
| Status | Meaning |
|---|---|
| New | The issue has been automatically created and is awaiting triage. |
| In Progress | The issue is being actively investigated. |
| Resolved | The issue has been fixed and is no longer occurring. |
| Ignored | The issue is not relevant or actionable and will be hidden. |
| regression | The issue was previously resolved but has reoccurred. |
Regression detection
If an issue marked Resolved occurs again, Ucoder Insight automatically flags it as a regression and reopens it. This helps catch cases where a fix didn't fully work or a bug was reintroduced in a later deploy.
Regression detection only applies to issues you've explicitly marked as Resolved. Errors on an Open or Ignored issue simply add to that issue's occurrence count — they aren't flagged as regressions.
What to check
- Error message and type
- Page URL where the error occurred
- Time and frequency of the event
- Browser and device breakdown
Use the stack trace and the affected page to reproduce the issue. Errors from browser extensions or external resources may not be actionable in your application, so verify the source before prioritizing a fix.
Troubleshooting
Initialize the SDK once, confirm the domain is verified, and inspect the browser console for initialization errors. Use debug: true during development to log tracking activity without sending analytics data.
See Configuration for initialization options.