
Overview
Understand the main analytics views in the Ucoder Insight dashboard.
Overview
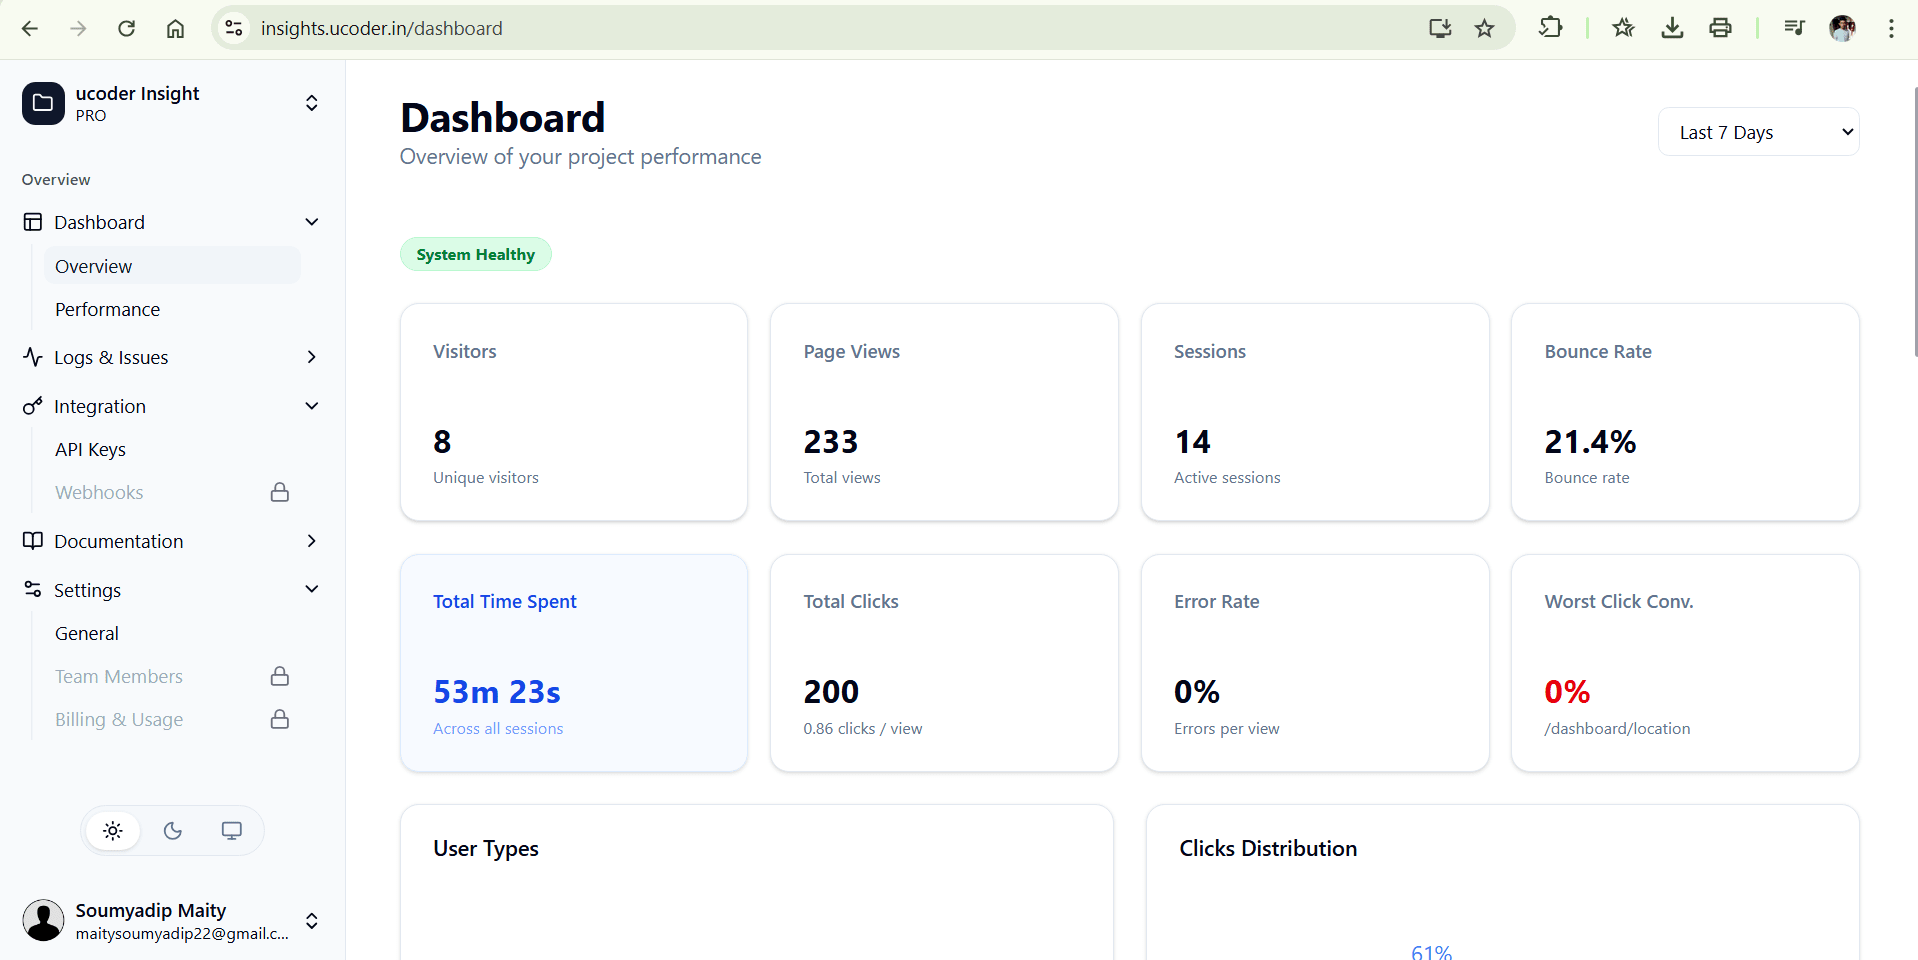
The dashboard brings together the data collected by your Ucoder Insight project. The available views depend on the tracking features enabled for the project.
Main signals
- Page views show visits to normalized page paths.
- Sessions group activity by the anonymous browser session used by the tracker.
- Clicks show interactions with supported interactive elements.
- Custom events record business actions that you send explicitly.
- Performance and errors show browser-side signals when those project features are enabled.
- Funnels show the conversion rate of a series of steps you define in the dashboard.
- Public sharing provides a shareable link to the page analytics view. (Available password protection for shared links.)
- Referrer shows the source of the traffic, such as a search engine or social media platform.
- Time on page indicates how long users spend on a particular page.
- Bounce rate measures the percentage of visitors who leave the site after viewing only one page.
Use the date range and project filters in the dashboard before comparing values. Demo screenshots and sample values should not be treated as production benchmarks.
Reading the dashboard
Start with page views and sessions to understand traffic volume. Then compare click, custom-event, error, and performance views to find pages that need attention. A metric is only meaningful when the tracking script is installed and the domain is verified.
Auto tracking
Automatic track is enabled by default when you install and initialize the SDK. It provided by default -
- Page views
- Clicks
- Performance metrics (if not disabled)
- Errors tracking
- Custom events
- Session tracking
- User agent and device information
- Referrer and UTM parameters
- Browser and OS information
- Rege & Dead click
See custom events for more information on sending your own events.