# Dashboard Overview (/docs/guides/dashboard)


# Dashboard Overview [#dashboard-overview]

Your dashboard provides a comprehensive snapshot of your project's health. Below is a breakdown of every metric, what it means, and how it is calculated.

<Callout type="warn" title="Note">
  All metrics are based on data collected from users visiting your website with
  the analytics script installed. Ensure you have set up the tracking code
  correctly to see accurate data. Here all numbers are from a demo project.
</Callout>

***

## Dashboard Sections [#dashboard-sections]

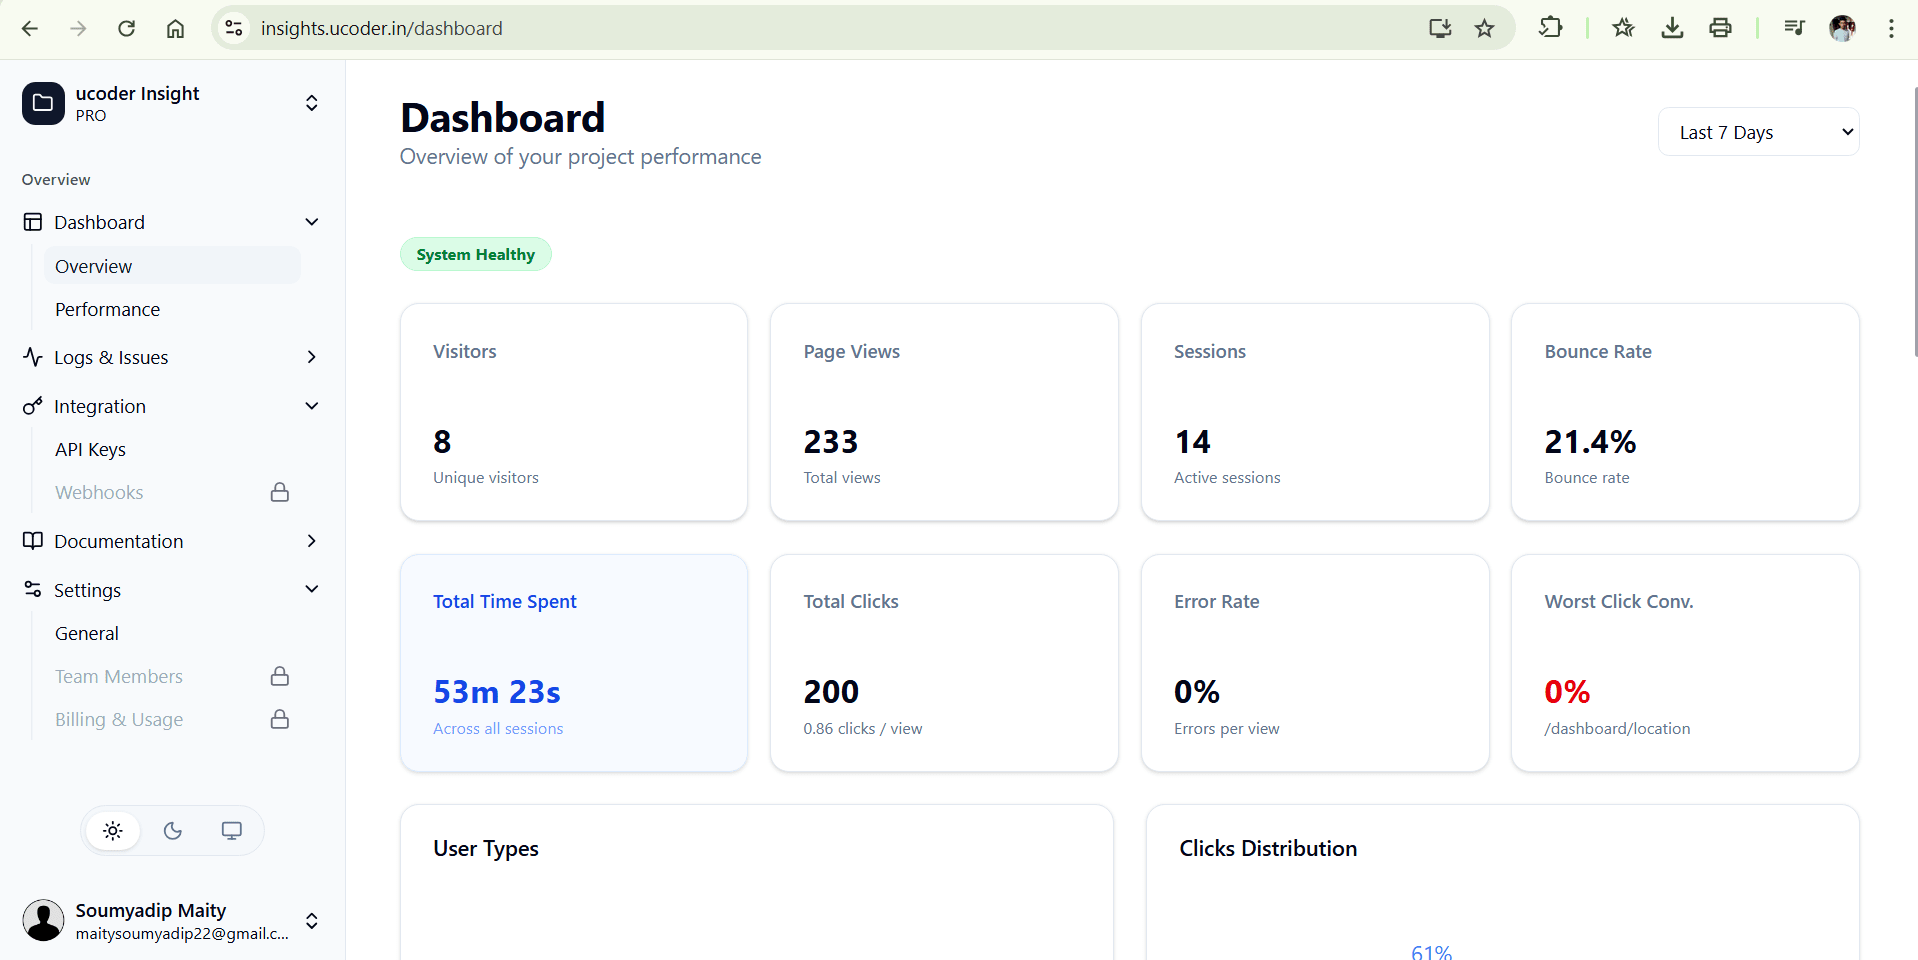
* here is a quick overview of the main sections , this is a demo site so value are change base your website data. keep reading for detailed explanation of each metric and how to interpret them.

*This is give your site overview data base on your website data keep reading*

<img src="https://res.cloudinary.com/dqh01bl7y/image/upload/q_auto/f_auto/v1773111514/dashbord_wmhrvv.png" alt="Dashboard Overview" className="w-full h-auto mt-6 mb-8 border rounded-lg object-cover" />

## Dashboard Metrics Breakdown [#dashboard-metrics-breakdown]

* **visitors:** Total number of unique users visiting your site.
* **page views:** Total number of pages loaded. Multiple views by the same user count here.
* **sessions:** Periods of active usage. A session ends after 30 minutes of inactivity
* **total time spent:** Cumulative time users spend on your site across all sessions.
* **total clicks:** Total number of clicks on buttons or links.
* **error rate:** Percentage of page views that resulted in a JavaScript error.
* **worst click conversion:** The page with the lowest click-to-view ratio.

## Error Analysis [#error-analysis]

### Error Rate [#error-rate]

**Value:** `30.3%` (Errors per view)

<Callout type="error" title="Critical Warning">
  A 30% error rate is very high. It means roughly **1 out of every 3 page
  views** crashes or throws a JavaScript error.
</Callout>

* **What it means:** This is the percentage of page views that resulted in an error.
* **Calculation:** `(Total Error Events / Total Page Views) * 100`.
* **Worst Error Page:** `Home` (9 errors). This tells you exactly where to start debugging.

***

## Charts & Breakdown [#charts--breakdown]

### User Types (New vs. Returning) [#user-types-new-vs-returning]

* **New:** Users visiting for the first time in the selected date range.
* **Returning:** Users who have visited before (identified by IndexDB & local storage).

### Clicks Distribution [#clicks-distribution]

**Example:** `Other (85%)` vs `Top (/form) (15%)`
This pie chart shows which pages receive the most physical interactions.

* **Insight:** Even though "Home" might be the *Most Viewed* page (15 views), the `/form` page is the *Top Clicked* page (17 clicks). This means users are highly active on the form.

### Duration Overview [#duration-overview]

**Example:** `Average: 0s` vs `Top Page (/form): 5s`

* **Top Page:** The specific page where users spend the most time reading or interacting.
* **Worst Page:** The page users leave the fastest.
* **Calculation:** We track the timestamps between page entry and exit (or next navigation).

***

## Summary of "Top & Worst" [#summary-of-top--worst]

Based on your current data:

<div className="overflow-x-auto w-full pb-4">
  | Metric          | Page    | Value     | Insight                  |
  | :-------------- | :------ | :-------- | :----------------------- |
  | **Most Viewed** | `Home`  | 15 views  | Main entry point.        |
  | **Top Clicked** | `/form` | 17 clicks | High engagement area.    |
  | **Worst Error** | `Home`  | 9 errors  | **Needs immediate fix.** |
</div>

***

## Performance & Web Vitals [#performance--web-vitals]

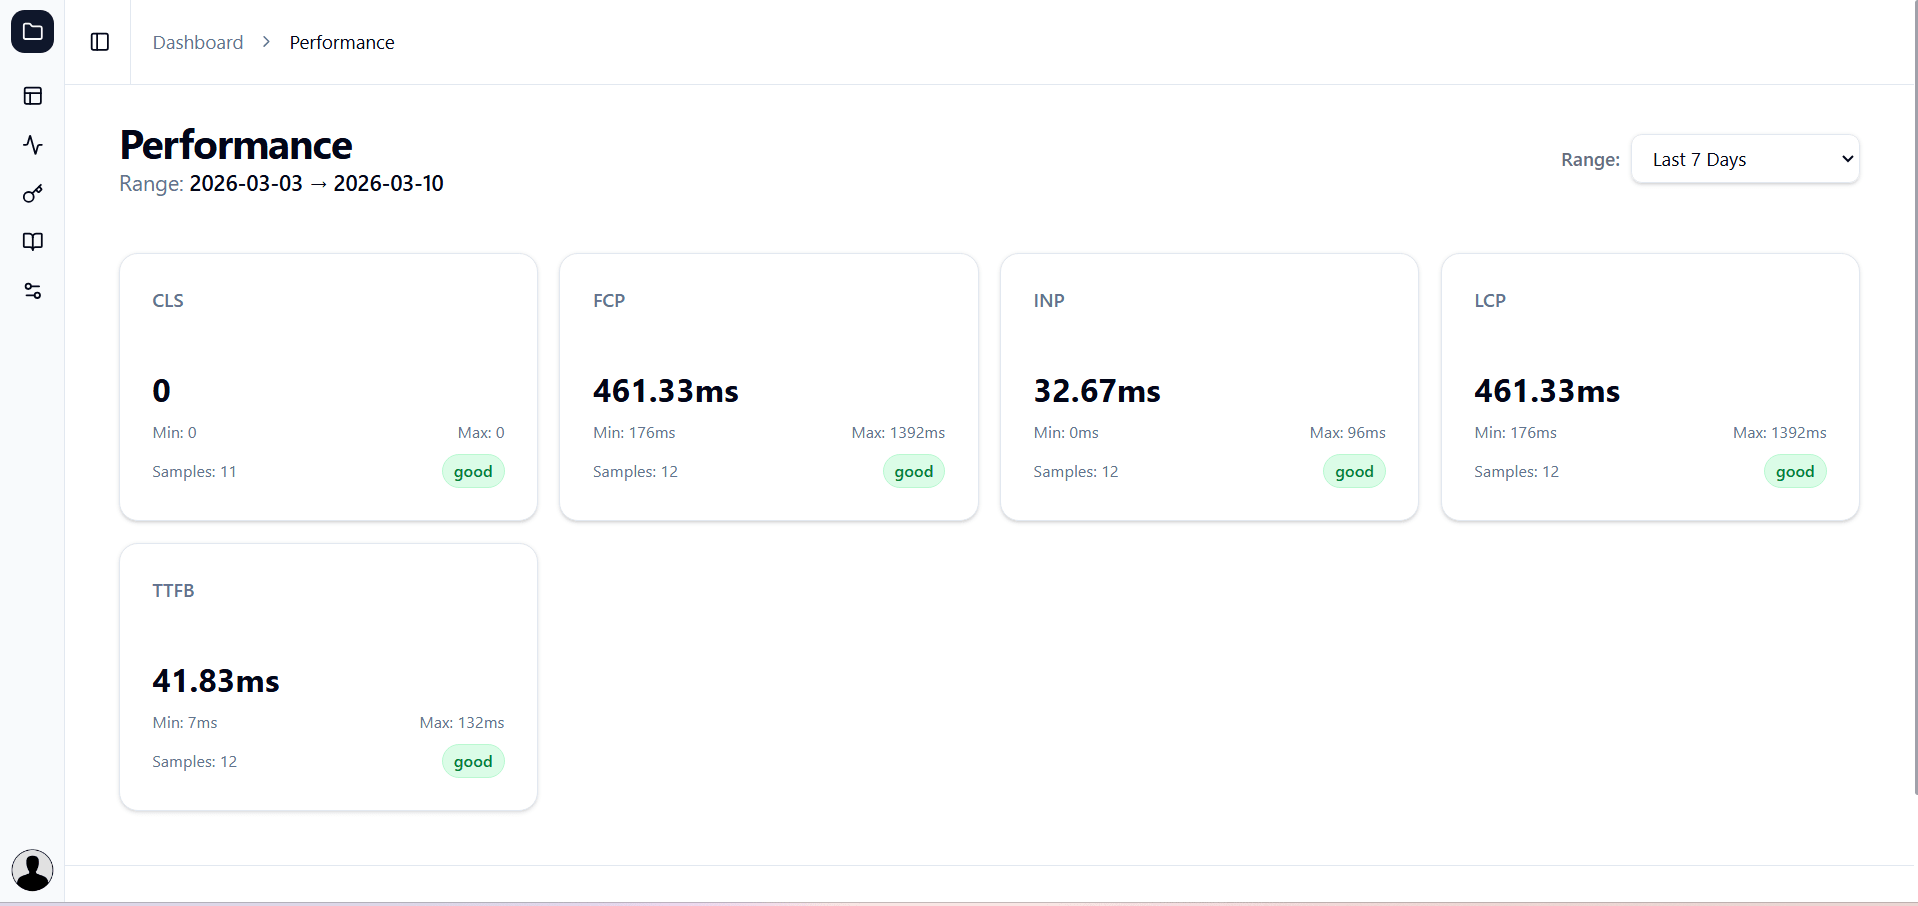
This section measures the **Speed** and &#x2A;*User Experience (UX)** of your website based on real user data (RUM - Real User Monitoring).

<img src="https://res.cloudinary.com/dqh01bl7y/image/upload/q_auto/f_auto/v1773111515/performance_x0s8hd.png" alt="performance metrics" className="w-full h-auto mt-6 mb-8 border rounded-lg object-cover" />

### Understanding the Metrics [#understanding-the-metrics]

We track Google's Core Web Vitals to help you improve your SEO score.

<div className="grid grid-cols-1 md:grid-cols-2 gap-6 my-6">
  {[
      {
        title: "LCP (Largest Contentful Paint)",
        icon: <ImageIcon className="h-4 w-4" />,
        value: "306.4ms",
        desc: "How long it takes for the largest image or text block to become visible. A fast LCP means users see content quickly.",
        link: "https://developer.mozilla.org/en-US/docs/Glossary/Largest_contentful_paint",
      },
      {
        title: "CLS (Cumulative Layout Shift)",
        icon: <Layout className="h-4 w-4" />,
        value: "0",
        desc: "Measures visual stability. Does the layout shift unexpectedly while loading?",
        link: "https://developer.mozilla.org/en-US/docs/Glossary/CLS",
      },
      {
        title: "INP (Interaction to Next Paint)",
        icon: <MousePointerClick className="h-4 w-4" />,
        value: "0ms",
        desc: "Responsiveness. How fast does the site react when a user clicks a button?",
        link: "https://developer.mozilla.org/en-US/docs/Glossary/Interaction_to_next_paint",
      },
      {
        title: "TTFB (Time to First Byte)",
        icon: <Zap className="h-4 w-4" />,
        value: "38.6ms",
        desc: "Server Speed. How long the browser waits before receiving the first piece of data.",
        link: "https://developer.mozilla.org/en-US/docs/Glossary/Time_to_first_byte",
      },
    ].map((metric, i) => (
      <div
        key={i}
        className="rounded-xl border bg-card text-card-foreground shadow-sm flex flex-col"
      >
        <div className="flex flex-col space-y-1.5 p-6 pb-2">
          <h3 className="font-semibold leading-none tracking-tight text-sm text-muted-foreground flex items-center gap-2">
            {metric.icon}
            {metric.title}
          </h3>
        </div>
        <div className="p-6 pt-0">
          <div className="text-2xl font-bold text-green-600">{metric.value}</div>
          <div className="text-xs text-muted-foreground mt-1 flex items-center gap-1">
            Status:{" "}
            <span className="text-green-600 font-bold uppercase">Good</span>
          </div>
          <div className="mt-4 p-3 bg-muted/50 rounded-lg text-xs space-y-2 border">
            <div className="font-semibold flex items-center gap-1.5 text-foreground">
              <Info className="h-3.5 w-3.5" /> What it means:
            </div>
            <div className="leading-relaxed text-muted-foreground">
              {metric.desc}
              <span className="inline-block whitespace-nowrap">
                <a
                  href={metric.link}
                  target="_blank"
                  rel="noopener noreferrer"
                  className="text-blue-600 dark:text-blue-400 font-medium hover:underline inline-flex items-center gap-1 ml-1 leading-none"
                >
                  Read more <ExternalLink className="h-3 w-3 shrink-0" />
                </a>
              </span>
            </div>
          </div>
        </div>
      </div>
    ))}
</div>

### Performance Benchmarks [#performance-benchmarks]

How do we decide if a score is "Good" or "Bad"? We follow Google's Web Vitals standards.

<div className="overflow-x-auto w-full pb-4">
  | Metric  | Good            | Needs Improvement | Poor            |
  | :------ | :-------------- | :---------------- | :-------------- |
  | **LCP** | Less than 2.5s  | 2.5s - 4.0s       | More than 4.0s  |
  | **INP** | Less than 200ms | 200ms - 500ms     | More than 500ms |
  | **CLS** | Less than 0.1   | 0.1 - 0.25        | More than 0.25  |
  | **FCP** | Less than 1.8s  | 1.8s - 3.0s       | More than 3.0s  |
</div>

<Callout type="info" title="Note on 'Samples'">
  The data shown is not a simulation. If you see `Samples: 5`, it means we
  collected performance data from **5 real users** visiting your site in the
  selected date range.
</Callout>